
Sustainability through Technology and Education
Create lasting behavioural change by educating students using real-time energy data. Inspire action and track the impact.
Innovative Technology
to Measure Energy
The Solar Schools program traces its origins back to 2002, when founders Rob Breuer and Mark Stenhouse began designing the technology to capture and analyse energy data from solar panels.
In the years since, Rob and Mark have remained committed to this important technology, continuing to grow and refine capabilities of their system.
Meet the Founders

MARK
STENHOUSE

ROB
BREUER
MARK
STENHOUSE
ROB
BREUER

Hands-On STEM Education
Our founders Rob and Mark, are passionate outdoor enthusiasts and advocates for sustainability. Together, they saw an important opportunity to match their energy technology with an equally robust educational program.
The team behind Solar Schools set out to empower children and teenagers to improve the future of our planet. With data as the foundation, an entire curriculum of activities has been designed to cover science, technology, engineering and mathematics learning areas.
Our comprehensive educational program launched in 2016, making it easy for schools to both teach and take action on energy efficiency.
Here's Why you should Care too
Check out these facts about our planet's health.
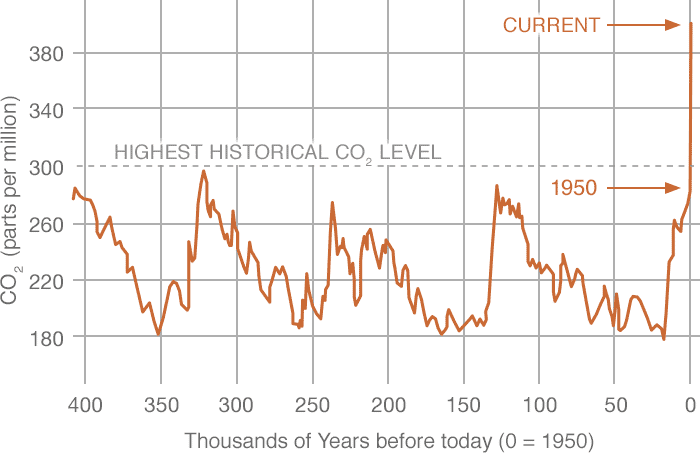
Carbon Dioxide
Carbon dioxide (CO2) is an important heat-trapping (greenhouse) gas, which is released through human activities such as deforestation and burning fossil fuels, as well as natural processes such as respiration and volcanic eruptions.
The graph shows CO2 levels during the last three glacial cycles, as reconstructed from ice cores. As you can see, this is far from a 'normal' cycle.
climate.nasa.gov
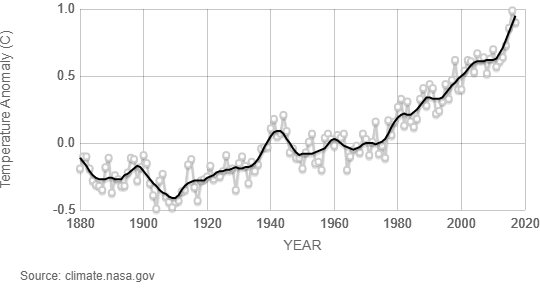
Global Temperature
17 of the 18 warmest years in the 136-year record all have occurred since 2001, with the exception of 1998.
This graph illustrates the change in global surface temperature relative to 1951-1980 average temperatures.
climate.nasa.gov
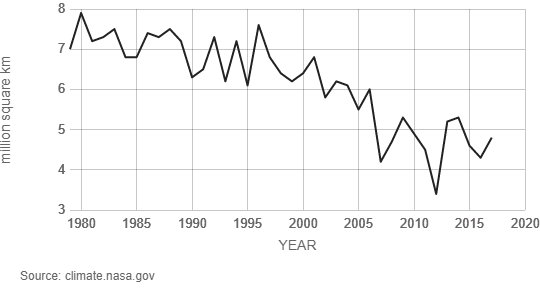
Arctic Sea Ice Minimum
Arctic sea ice reaches its minimum each September. September Arctic sea ice is now declining at a rate of 13.2 percent per decade, relative to the 1981 to 2010 average.
This graph shows the average monthly Arctic sea ice extent each September since 1979, derived from satellite observations.
climate.nasa.gov
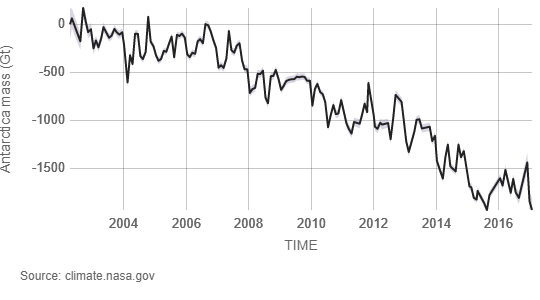
Land Ice
Data from NASA's GRACE satellites show that the land ice sheets in Antarctica has been losing mass since 2002. The ice sheet has seen an acceleration of ice mass loss since 2009.
climate.nasa.gov
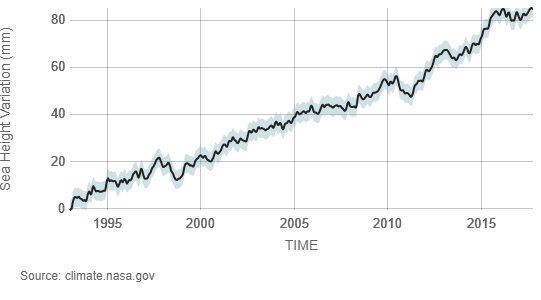
Sea Level
Sea level rise is caused primarily by two factors related to global warming: the added water from melting ice sheets and glaciers and the expansion of sea water as it warms.
The graph tracks the change in sea level since 1993 as observed by satellites.
climate.nasa.gov
Today, the Solar Schools program combines both energy generation and energy consumption data. We're proud to present the results of our long-standing investment in research and development.
Learn More about What's Possible when you bring Technology and Education together
Get Involved